1.

The so far puzzling increase in deaths in Spain and Europe in 20221.2.1. System for monitoring daily all-cause mortality. of the 1
Excess mortality in young people in Spain: Data
| GRAPH 1 Canary Islands 01/01/2017
to 31/12/2022,
all sexes, all age groups, annual presentation2  Mortality of the population as a whole shows more excesses in 2022 than in 2020, in winter and in summer. GRAPH 2
 TABLE 14
The annual excess mortality of the population as a whole in 2022 is thirteen times that of 2020, the first year of the COVID-19 pandemic, and almost triple that of 2021. GRAPH 3 Canary Islands 01.01.2017
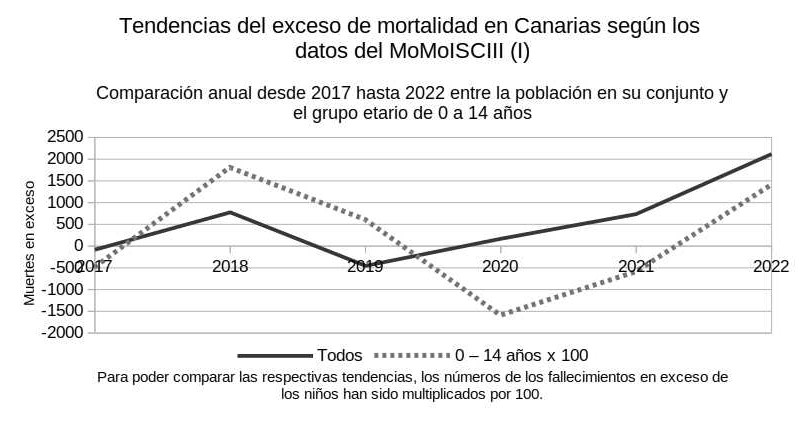
to 31.12.20223,
all sexes, comparison of total population with age cohort 0 - 14 years3  (Own graph, R.W. To illustrate the respective trends, the children's deaths were multiplied by 100.) For the population as a whole, the time span from early 2017 to early 2020 saw a decline in excess mortality, interrupted in 2018. The first year of the COVID-19 pandemic is within the normal range, with excess mortality below the 2018 level, which is reached in 2021. The year 2022, however, is marked by an extraordinary excess mortality, tripling that of the previous year, almost THIRTEEN times higher than in the first year of the pandemic. For boys and girls, the peak of excess mortality is in 2018, followed by a decline to negative values even in 2020. In 2022, however, there is a considerable increase that does not reach the 2018 values.
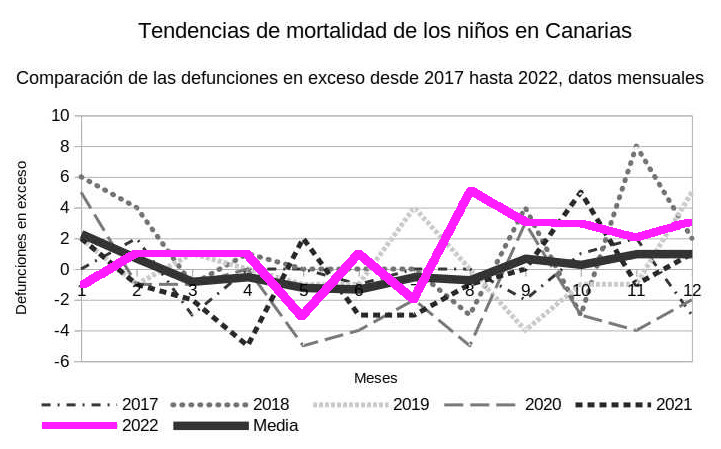
The increase of the excess is seen in the winter months, from November to February (where the average is higher), much less in the winter 2020-2021 and non-existent in the winter 2021-2022. The averages for the months March to August are negative. However, in the year 2022, with a negative value until July, there is a very pronounced, long-lasting and atypical rise from August onwards. The trend does not continue in January 2023, but it does so in February. GRAPH 4 Canary Islands,
all sexes, age cohort 0 - 14 years, comparison of monthly excess mortality from 01.01.2017 to 31.12.20224  (Own graph and own calculation of the mean, R.W.) Most of the year 2022, the excess is above the average of the years since 2017. |
|||||||||||||||||||||||||||||||||||||||||||||||||||||||||||||||||||||||||||||||||||||||||||||||||||||||||||||||||||||||||||||||||||||||||||||||||||||||||||||||||||||
Notas
1) https://momo.isciii.es/panel_momo/#section-momo
Elegir:
Región: España o la provincia;
Sexo, Grupo de edad, Fecha: desde - hasta. Debajo del gráfico producido
está la tabla correspondiente.
Véase todas las tablas descargadas en 5. Materiales.
2) Downloaded with the corresponding table from https://momo.isciii.es/panel_momo/#section-momo
on 06/01/2023
3) Downloaded with the corresponding table from https://momo.isciii.es/panel_momo/#section-momo
on 06/01/2023
4) Data of MoMoISCIII, downloaded from https://momo.isciii.es/panel_momo/#section-momo
on 06/01/2023.
Decreases in green, increases in red. Own colours, RW.
5) Data downloaded in the corresponding tables (see under 4. Materiales) from https://momo.isciii.es/panel_momo/#section-momo
on 07/01/2023
Values above 1 in red; bold, colours and calculations of sums and
averages are my own, RW.
Updated on 25/02/2023.