1.

The so far puzzling increase in deaths in Spain and Europe in 20221.2.1. System for monitoring daily all-cause mortality of the 1
Excess mortality in young people in Spain: Data
| GRAPH 1 Canary Islands, all sexes,
all age groups, 01/01/2022 to 05/03/20232
 GRAPH 2 Canary Islands, all sexes,
age group 0-14 years, 01/01/2022 to 05/03/20232
 TABLE 12
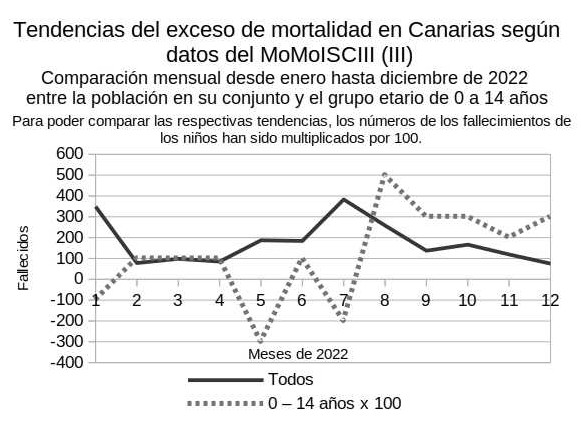
(Update!) GRAPH 3 Canary Islands 01/01. to
31/12/2022, monthly data, all sexes,
comparison of total population with age cohort 0 - 14 years2  (Own diagram, R.W. To illustrate the respective trends, the deaths of children were multiplied by 100). For the total population, excess mortality initially decreases in the course of 2022, starting in January with excess mortality almost as high as in the following July, until it rises from May onwards and turns into very pronounced summer excess mortality, before decreasing again from November onwards. For children, excess mortality peaks in August, with another peak in December. See also the comparison of monthly excess mortality in this age cohort since 2017: 1.2.1.3. Canaries 2017 - 2022, TABLE 2 and GRAPH 4. |
 ---> Continue reading:
1.2.1.5. Political and media discussion
Notes
1) https://momo.isciii.es/panel_momo/#section-momo
Choose::
Región: Spain or a province;
Sexo, Grupo de edad (age group), Fecha (date): desde - hasta (from-to).
Below the graph produced there ist the corresponding table.
See all the downloaded tables in 4. Materials.
2) Downloaded with the corresponding table, monthly presentation, from https://momo.isciii.es/panel_momo/#section-momo on
07/03/2023.
To explain the legend of the diagrams and the terms used:
"'Mortalidad notificada por todas las causas' = reported all-cause
mortality (that which is actually received)[light grey, RW],
'mortalidad observada por todas las causas' = observed all-cause
mortality (that to which a lag estimate is applied to try to approximate
what will be received)[dark grey, RW], 'estimadas base' = base
estimates [blue, based on the average of past years, RW], 'exceso
por todas las causas' = all-cause excess (difference between observed
and base estimate mortality) and 'defunciones atribuibles al exceso' =
deaths attributable to excess [red, RW] or 'defecto' = shortfall
[violet, RW] of temperature (difference between expected deaths
with the effect of temperature and base estimates), for the selected
territorial scope, sex, age group and date range. Pay attention to the
selected date range and grouping, if your range contains an incomplete
week or month, it will also be shown incomplete in the aggregation."