1.


Contents

1. Excess mortality in young people in Europe and Spain: EXECUTIVE SUMMARY
Definition of the problem - Method - Results - Discussion


1.1. EuroMOMO

1.1.1. Data


1.1.2. Discussion by EuroMOMO


1.2. Spain: MoMoISCII and Instituto Nacional de Estadística (INE)

1.2.1. System for monitoring daily all-cause mortality. of the Institute of Health Carlos III (MoMoISCIII)

1.2.1.1. 2017 - 2022

1.2.1.2. 2022

1.2.1.3. Canaries 2017 - 2022

1.2.1.4. Canaries 2022

1.2.1.5. Political and media discussion


1.2.2. National Institute of Statistics (INE)

1.2.2.1. 1980 - 2021

1.2.2.2. 2017 - 2022

1.2.2.3. 2020 - 2021: Causes of death between 5 and 24 years of age with the steepest increase


1.2.2.4. 2022, first half of the year: Causes of the increase in deaths among 5-24 year olds compared to 2021


1.2.2.5. 1980 - 2022, first half of the year: The main causes of the recent increase in deaths among 5-24 year-olds


1.3. Concluding discussion


2. Excess mortality in Spain in summer 2022: ABSTRACT
Definition of the problem - Method - Results - Discussion


2.1. Usual summer mortality


2.2. From June to the end of August of 2022


2.3. Discussion in the media


2.4. Concluding discussion


3.
Sources


4. Materials
Daran wird noch gearbeitet


I appreciate hints on errors and suggestions for improvement:
r_a_wagner@gmx.de


The so far puzzling increase in deaths in Spain and Europe in 2022

Excess mortality in young people in Spain: Data

1.2.1. System for monitoring daily all-cause mortality. of the Institute of Health Carlos III (MoMoISCIII)1

1.2.1.2. 2022
Comparison between the population as a whole and the age group 0-14 years

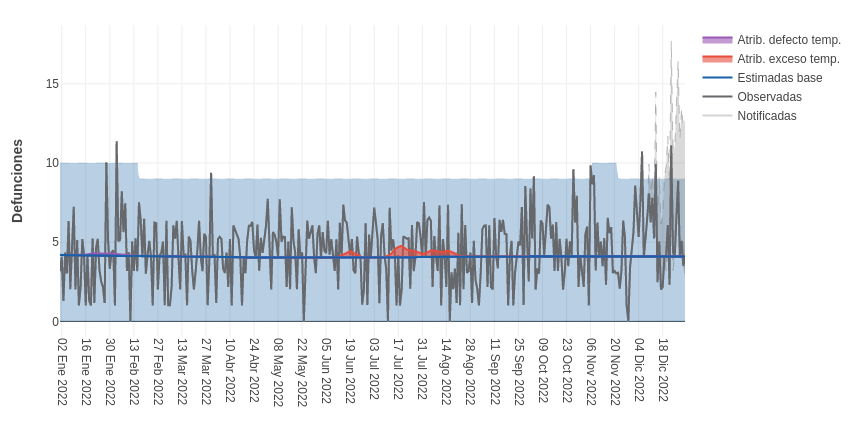
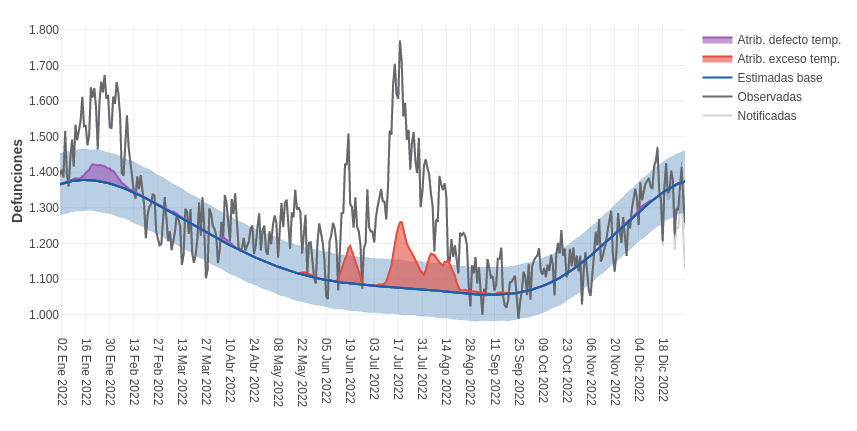
GRAPH 1
Spain 01/01 to 31/12/2022,
all sexes, all age groups2 
España, todos, 01-12/2022
Over the course of 2022, the excess mortality of the population as a whole falls, rising from April onwards and leading to an unusually strong summer excess, before falling again from August onwards.

GRAPH 2

  Spain 01/01 a 31/12/2022,
all sexes, age group 0-14 years
2
España, 0-14 años, 2022

TABLE 1
Spain 01/01/2022 to 28/02/2023, all sexes,
total population compared with age cohort 0 - 14 years3

Year-month All
Age group 0 - 14 years
2023-02
572
-8
2023-01
-397
6
2022-12 1289
57
2022-11 -473
8
2022-10 1472
30
2022-09 767
7
2022-08 5606
-2
2022-07 11419
11
2022-06 4454
15
2022-05 3349
22
2022-04 1496
9
2022-03 -900
0
2022-02 1590
17
2022-01 4701
-18
(Decreases in green, increases in red. Own colours, RW.)


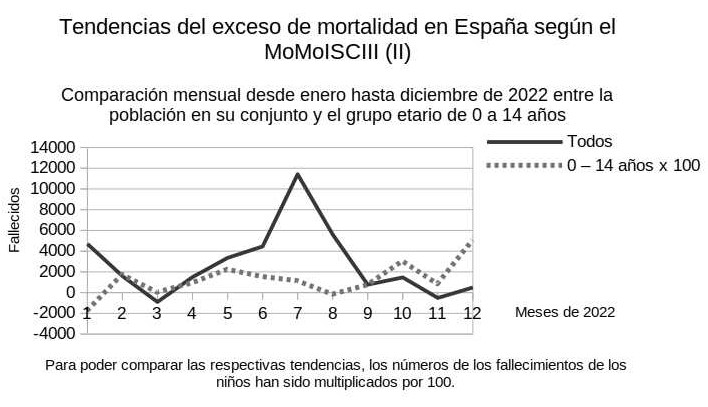
Update! GRAPH 3
Spain 01/01 to 31/12/2022, all genders,
total population compared with age cohort 0 - 14 years2
Comparación niños y población
(Own graph, R.W. To illustrate the respective trends, the children's deaths were multiplied by 100.)

With children, excess mortality peaks in February, May, October and December. In contrast to the general population, which suffers many additional deaths that summer, the excess with children drops from June onwards and starts to rise again in September. In January and February 2023 this trend does not continue.


---> Continue reading: 1.2.1.3. Canaries 2017 - 2022
Comparison between the population as a whole and the age group 0 - 14 years


Notes


1) https://momo.isciii.es/panel_momo/#section-momo
Select: Región: Spain or a province;
Sexo (gender), Grupo de edad (age group), Fecha (date/space of time): desde - hasta (from - until). Below the graph produced there is the corresponding table.
See all the downloaded tables in 4. Materials.


2) Monthly presentation, downloaded with the corresponding table from https://momo.isciii.es/panel_momo/#section-momo on 06/01/2023.


3) Monthly presentation, downloaded from https://momo.isciii.es/panel_momo/#section-momo on 24/02/2023, updated on 07/03/2023.